
Table of contents:
- Introduction: Why Condition Monitoring vs Predictive Maintenance Still Matters in 2025 and Beyond
- What is Condition Monitoring (CM)?
- What is Predictive Maintenance (PdM)?
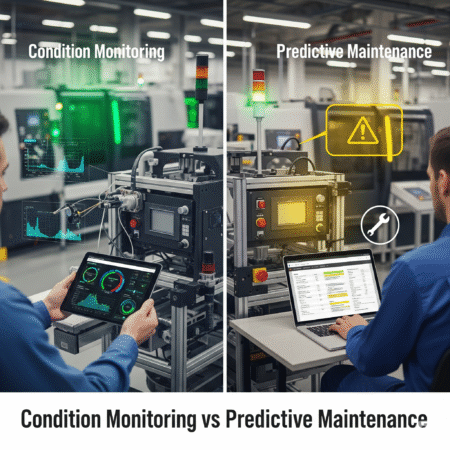
- Condition Monitoring vs Predictive Maintenance: Core Differences
- Impact on FEED Deliverables (Engineering Perspective)
- Business Case & ROI Framework
- Decision Matrix – When to Choose CM vs PdM
- Implementation Roadmap (Step-by-Step)
- Step 1 – Define Objectives & Asset Scope
- Step 2 – Data Readiness Assessment
- Step 3 – Select Monitoring Strategy
- Step 4 – Infrastructure & Integration
- Step 5 – Analytics & Visualization
- Step 6 – Pilot & Validation
- Step 7 – Scale & Institutionalize
- Step 8 – Continuous Improvement
- Evergreen Roadmap Summary Table
- Technology Enablers (Neutral)
- Buyer’s Guide (Long-Term Evergreen)
- Case Studies Across Industries (Timeless Lessons)
- FAQ + Conclusion
Introduction: Why Condition Monitoring vs Predictive Maintenance Still Matters in 2025 and Beyond
If you’re an engineer, plant manager, or decision-maker in oil & gas, power, or manufacturing, you’ve probably heard the terms Condition Monitoring (CM) and Predictive Maintenance (PdM) thrown around like buzzwords.
But here’s the catch:
Most people lump them together. They think CM and PdM are the same thing-just “monitor your assets and predict when they’ll fail.” That’s wrong. And this misunderstanding is costing companies millions every year.
Why this comparison matters today
- Rising downtime costs: Every minute of unplanned downtime in oil & gas can cost up to $25,000–$50,000. (And that’s a conservative 2025 estimate.)
- AI hype vs. reality: Everyone talks about AI-driven maintenance, but few understand that Condition Monitoring is the foundation you need before you even dream of PdM.
- Budget pressure: Plants face shrinking OPEX/CAPEX budgets. Choosing between CM and PdM isn’t just technical-it’s a business survival decision.
So before you decide to invest in that shiny AI-driven platform or load up your Instrument Index with hundreds of sensors, you need to understand the real differences between Condition Monitoring and Predictive Maintenance.
Quick Snapshot: CM vs PdM in 2025
| Aspect | Condition Monitoring (CM) | Predictive Maintenance (PdM) |
|---|---|---|
| Definition | Real-time measurement of equipment health using sensors and alarms | Uses CM data + analytics/AI to forecast failures before they occur |
| Investment Level | Lower (sensors, alarms, historian) | Higher (AI, machine learning, integration with CMMS/ERP) |
| Time Horizon | Detect problems as they happen | Predict problems before they happen |
| Use Case | Basic asset protection (e.g., vibration alarm) | Long-term reliability strategy (e.g., AI-driven pump failure prediction) |
The problem most companies face
Many organizations jump straight into predictive maintenance projects because vendors promise double-digit ROI. But without a solid condition monitoring foundation, those PdM projects often fail-due to poor data quality, missing sensors, or lack of integration with DCS/PLC.
Think of it like this:
- Condition Monitoring = the diagnostic check-up at the doctor.
- Predictive Maintenance = the health forecast based on your lifestyle and data history.
You can’t have a meaningful forecast if you never did the basic check-up.
Read More:
Why this article matters to you
In this guide, we’ll break down:
- The real technical differences between CM and PdM (ISO-backed).
- How they impact FEED deliverables like Instrument Index, Datasheets, Architecture, and JB Wiring.
- How to decide-using a 5-step decision matrix-whether your plant should stay at CM or evolve to PdM.
- The ROI benchmarks for 2025 and beyond, so you can argue your case with finance teams and execs.
By the end, you won’t just know the difference-you’ll know which one makes sense for your plant in 2025 and how to avoid burning cash on the wrong choice.
What is Condition Monitoring (CM)?
If you want to understand predictive maintenance, you first need to understand its foundation: Condition Monitoring (CM). Think of CM as the first step in an asset reliability journey. Without it, predictive analytics, AI models, or digital twins simply don’t work.
Definition
Condition Monitoring is defined in ISO 17359:2018 as the process of monitoring specific parameters of machinery (such as vibration, temperature, pressure, or oil quality) to identify significant changes that indicate developing faults.
In simple terms:
- CM = real-time health check for your equipment.
- It doesn’t predict the future-it tells you the present.
Key Elements of Condition Monitoring
- Measurement Parameters
- Vibration → Detects imbalance, misalignment, bearing wear.
- Temperature → Identifies overheating, lubrication failure.
- Acoustic/Ultrasonic → Finds early-stage leaks or cavitation.
- Oil Debris/Particle → Reveals wear before a breakdown.
- Data Collection
- Handheld devices (portable analyzers).
- Online sensors connected to DCS/PLC.
- Wireless IoT sensors for remote assets.
- Standards & Frameworks
- ISO 17359 → Condition monitoring framework.
- ISO 10816 → Vibration measurement guidelines.
- API 670 → Machinery protection systems (critical in oil & gas).
Quick View: CM in Action
| Aspect | What It Means in CM | Example |
|---|---|---|
| Objective | Detect issues in real-time | Pump vibration alarm triggers operator action |
| Investment | Low–Medium (sensors + basic integration) | $5k–$50k per critical machine |
| Outcome | Early warning + fault detection | Bearing defect spotted before catastrophic failure |
Why CM is Still Relevant in 2025 (and Beyond)
- Foundation for Predictive Maintenance: Garbage in, garbage out. PdM models are useless without reliable CM data.
- Compliance & Safety: Many industries (oil & gas, nuclear, aviation) mandate CM under ISO/API standards.
- Budget-Friendly Start: Plants can start with CM at relatively low cost before scaling to AI/ML.
- Long-Term Evergreen Value: Unlike flashy AI tools that change yearly, CM principles (vibration, temperature, oil analysis) have remained stable for decades.
Pro Tip for Engineers & Managers
If you’re planning a long-term maintenance strategy, always treat Condition Monitoring as your baseline investment. Whether you move to Predictive Maintenance in 2 years or 10 years, CM ensures you’re building on solid, ISO-compliant data.
What is Predictive Maintenance (PdM)?
If Condition Monitoring (CM) is the “present tense” of asset health, then Predictive Maintenance (PdM) is the “future tense.” PdM doesn’t just tell you what’s happening right now-it forecasts what will happen, and when.
Read More: AI-Powered Predictive Maintenance in Oil & Gas Complete Guide (2025-2030)
In simple terms: PdM = CM + Data Integration + Analytics + Prediction.
Definition (ISO-backed)
According to ISO 13381-1, predictive maintenance is the methodology of forecasting machinery failure by analyzing monitored parameters, enabling interventions to be scheduled before failures occur.
So, while CM might tell you a pump is vibrating abnormally, PdM tells you:
“This pump bearing will likely fail in 38 days, if not replaced.”
Core Components of PdM
- Data Sources
- CM data: vibration, thermal, acoustic, oil debris.
- Process data: flow, pressure, temperature.
- Operational data: runtime, load cycles.
- Analytics Layer
- Statistical modeling → regression, trend lines.
- Machine learning/AI → anomaly detection, pattern recognition.
- Digital twins → virtual replicas for scenario simulation.
- Integration Points
- CMMS/ERP systems → Automatic work order generation.
- Control systems (DCS/SCADA) → Real-time feedback loops.
- Cloud platforms → Long-term storage + enterprise visibility.
CM vs PdM in Practice: Oil & Gas vs Power Plant
| Industry | PdM Application | Outcome |
|---|---|---|
| Oil & Gas | Offshore pumps & compressors analyzed via vibration + ML models | Prevented unplanned downtime costing millions/day |
| Power Plant | Turbine thermal data + acoustic monitoring integrated with AI | Predicted blade crack failure, avoided forced outage |
Why PdM Matters in 2025 and Beyond
- Financial impact: In oil & gas, every day of downtime can cost $1M+. PdM slashes unplanned shutdowns.
- Safety & compliance: Predicting failures in turbines, compressors, and pipelines reduces catastrophic risks.
- Scalability: PdM frameworks (data → model → decision) are evergreen; only tools evolve, but methodology stays relevant.
- AI & ML maturity: With modern computing power, PdM accuracy keeps improving-but always built on CM data.
Pro Tip for Engineers & Managers
Never see PdM as a “replacement” for CM. Instead, think of it as the next layer.
- CM = data acquisition.
- PdM = turning that data into foresight.
If you’re in oil & gas or power generation, PdM isn’t just an upgrade-it’s a way to turn regulatory pressure and downtime risks into measurable ROI.
Condition Monitoring vs Predictive Maintenance: Core Differences
At first glance, Condition Monitoring (CM) and Predictive Maintenance (PdM) look like cousins-both rely on data, sensors, and standards. But the truth is: they serve different purposes in an asset’s lifecycle.
Think of it this way:
- CM = Your health check (measuring blood pressure today).
- PdM = Your health forecast (predicting heart attack risk in 6 months).
Both are essential, but the depth, cost, and skills required are very different.
The Role of Data
- CM relies mostly on real-time data (vibration, temperature, oil analysis) and provides alarms or alerts.
- PdM integrates multiple data streams (CM + process + operational + historical data) and applies analytics/AI to forecast failures.
Cost & Investment Level
- CM → Low-to-medium capex. Ideal for plants wanting quick wins (install vibration or thermal sensors on critical pumps).
- PdM → Medium-to-high investment. Needs not only sensors but also data infrastructure, analytics, and skilled engineers/data scientists.
Skills Required
- CM → Maintenance technicians trained on handheld analyzers, reliability engineers interpreting ISO-based vibration charts.
- PdM → Cross-functional teams (maintenance, IT/OT, data scientists) to manage models, clean data, and interpret AI outputs.
Deliverables for the Business
- CM: Alarm reports, trend charts, fault detection logs.
- PdM: Failure probability forecasts, Remaining Useful Life (RUL) estimates, and auto-generated maintenance work orders.
Quick Comparison Table: CM vs PdM
| Aspect | Condition Monitoring (CM) | Predictive Maintenance (PdM) |
|---|---|---|
| Data | Real-time equipment parameters (vibration, thermal) | Integrated CM + process + AI models |
| Cost Level | Low–Medium (basic sensors, handheld devices) | Medium–High (sensors + IT/analytics stack) |
| Skills | Technicians & reliability engineers | Engineers + IT/OT + data scientists |
| Deliverables | Fault detection, alarms, trend reports | Failure forecasts, RUL, auto work orders |
| Use Case | Quick wins, compliance checks, safety monitoring | Long-term ROI, downtime avoidance at scale |
Industry Example: Oil & Gas vs Power Plant
- Oil & Gas → CM might detect unusual compressor vibration offshore, triggering a maintenance check. PdM would forecast bearing degradation 30 days ahead, allowing operators to align with supply-chain logistics.
- Power Plant → CM alarms when turbine temperature rises abnormally. PdM, however, models blade stress over time and predicts crack propagation, avoiding catastrophic outage.
Takeaway
- CM = Foundation. Quick to implement, essential for compliance, and ensures baseline reliability.
- PdM = Evolution. Requires more investment but pays back through avoided downtime and optimized planning.
The smartest plants don’t choose one over the other-they layer PdM on top of CM. This hybrid approach ensures they capture immediate wins while building a long-term predictive capability.
Impact on FEED Deliverables (Engineering Perspective)
In oil & gas and power plant projects, Front-End Engineering Design (FEED) isn’t just about layouts and cost estimates-it’s where the foundation of reliability is built. The choice between Condition Monitoring (CM) and Predictive Maintenance (PdM) directly shapes FEED deliverables.
Why? Because decisions made at FEED ripple downstream: the Instrument Index, Datasheets, Cable Schedules, JB Wiring, and Control System Architecture will all look different depending on your maintenance strategy.
Instrument Index
- CM Approach: Includes standard sensors like vibration probes, temperature elements, and pressure transmitters.
- PdM Approach: Adds redundant sensors (for reliability) and specialized devices (e.g., acoustic emission sensors, oil debris monitors). Also includes data integration tags.
Example: A compressor in a gas plant might move from 4 vibration probes (CM) to 4 probes + 2 redundant accelerometers + lube oil particle counter (PdM).
Datasheets
- CM: Focus on operational specs (range, accuracy, ingress protection).
- PdM: Adds data-centric parameters such as sampling frequency, FFT range, digital output protocol (e.g., Modbus TCP, OPC UA, MQTT).
In a power plant turbine, PdM datasheets often highlight high-resolution dynamic data capture for machine learning analytics.
Cable Schedule & Routing
- CM: Conventional 4–20mA or HART cables, routed alongside other process signals.
- PdM: Requires higher bandwidth cabling (twisted pair, Cat6/7, or even fiber) and routing designed to minimize EMI that could distort high-frequency vibration or acoustic data.
Offshore platforms now allocate separate trays for predictive monitoring lines to avoid noise coupling.
JB Wiring
- CM: Simple JB wiring grouped by equipment type, sized for current scope.
- PdM: JB layouts consider spare capacity for future expansion, segregation between power and data signals, and sometimes shield grounding provisions for high-speed sensors.
A refinery FEED study in Europe recommended 20% spare JB terminals to allow PdM retrofits without rewiring.
Control System Architecture
- CM: Data flows from field instruments → PLC/DCS → historian → basic trend analysis.
- PdM: Includes:
- Edge gateways for preprocessing (FFT, anomaly scoring).
- Integration with CMMS/ERP for automated work orders.
- Secure cloud bridge for AI/ML-based analytics.
PdM-ready FEED diagrams typically show a parallel data pipeline: one to DCS for operations, one to analytics servers for prediction.
Comparison Snapshot
| Deliverable | CM Focus | PdM Focus |
|---|---|---|
| Instrument Index | Basic sensors | Redundant + smart sensors |
| Datasheets | Accuracy, range | Sampling rate, protocol |
| Cable Schedule | Standard cables | High-bandwidth, EMI control |
| JB Wiring | Current needs | Expansion, segregation |
| System Architecture | DCS + historian | Gateways + AI-ready pipeline |
Key takeaway:
Your FEED deliverables are not “neutral”-they already reflect whether you’re building for Condition Monitoring or for Predictive Maintenance. Planning PdM at FEED avoids costly retrofits, keeps EPCs aligned, and future-proofs your plant for 20+ years of operation.
Business Case & ROI Framework
No matter how advanced your sensors or algorithms are, executives will always ask one question:
“What’s the ROI?”
Both Condition Monitoring (CM) and Predictive Maintenance (PdM) promise to reduce downtime and extend asset life. But the business case is built differently.
Core ROI Logic
- Downtime Cost: Lost production + repair cost + safety/environmental penalties.
- Implementation Cost: Hardware (sensors, gateways), software (licenses, storage), engineering (installation, training).
- ROI Equation:
ROI = (Avoided Downtime Cost + Extended Asset Life) − (Implementation Cost) / Implementation Cost
This framework stays relevant whether you’re running a gas turbine in a power plant or a compressor in an offshore oil platform.
CM vs PdM: Cost & Benefit Landscape
| Aspect | Condition Monitoring (CM) | Predictive Maintenance (PdM) |
|---|---|---|
| Upfront CapEx | Low → basic sensors + historian integration | Medium to High → smart sensors, gateways, AI/ML infra |
| Opex | Moderate → manual data analysis | Lower over time → automation reduces manual effort |
| Downtime Avoidance | Detects issues before failure (reactive savings) | Predicts failures weeks in advance (proactive savings) |
| Asset Life Extension | Limited impact | Significant (optimized maintenance intervals) |
| Payback Period | 12–24 months (quick wins) | 18–36 months (higher, but stronger long-term ROI) |
Oil & Gas Example (Compressor Train)
- Unplanned outage cost: $1M per day.
- CM Investment: $150K.
- PdM Investment: $400K.
- Savings:
- CM → avoids 2 days of downtime per year = $2M. ROI = 12x.
- PdM → avoids 5 days of downtime per year = $5M. ROI = 11.5x (but grows year 2+ as models mature).
Power Plant Example (Gas Turbine)
- Downtime cost: $500K per day.
- CM Setup: $120K, avoids 1 day outage = ROI 3x.
- PdM Setup: $300K, avoids 3 days outage = ROI 4x.
Strategic Angle
- CM = Low entry barrier → quick wins, often used as first step.
- PdM = Higher upfront → future-proof, best for high criticality assets.
- Both can be staged: start with CM, scale into PdM when data maturity and budget align.
Key takeaway:
When presenting to executives, don’t talk about “FFT resolution” or “OPC UA.” Talk about millions saved in avoided downtime, asset life extension, and payback periods. That’s how you secure buy-in for either CM or PdM.
Decision Matrix – When to Choose CM vs PdM
Not every asset deserves a full-blown Predictive Maintenance (PdM) setup. Sometimes, a well-executed Condition Monitoring (CM) program delivers 80% of the value at 20% of the cost.
So how do you decide? Here’s an evergreen decision matrix you can use across Oil & Gas, Power, and Manufacturing.
Core Factors in Decision Making
- Asset Criticality: How much downtime hurts production, safety, or environment.
- Data Availability: Historical and real-time sensor data maturity.
- Budget & Resources: CapEx, Opex, and skill availability.
- Maintenance Philosophy: Run-to-failure acceptable? Or zero tolerance?
Decision Matrix
| Factor | Choose Condition Monitoring (CM) | Choose Predictive Maintenance (PdM) |
|---|---|---|
| Asset Criticality | Medium → non-bottleneck equipment (pumps, fans) | High → turbines, compressors, generators |
| Data Availability | Limited → basic vibration, temperature logs | Rich → multi-sensor + historian/ERP data |
| Budget | Tight budgets or quick payback demand | Larger CapEx tolerance, long-term ROI |
| Skill Set | Team skilled in manual trending | Data science + reliability engineering team |
| Time Horizon | Need results within 6–12 months | Accept 18–36 months maturity curve |
Oil & Gas Example
- Offshore Pump Skids: Use CM (vibration, temperature). Failures are disruptive but manageable.
- Compressor Trains: Go PdM (multivariate sensor + AI models). A 2-day outage = multi-million loss.
Power Plant Example
- Auxiliary Fans: CM with thermal + vibration sensors → enough to catch early imbalance.
- Gas Turbine Rotor: PdM with AI-driven modeling → prevents catastrophic failures and forced outages.
Rule of Thumb
- Start small with CM on less critical assets → quick ROI, easy wins.
- Scale into PdM for high-value, high-risk equipment once you have:
✅ Enough historical data
✅ Budget & skilled team
✅ Executive buy-in
Key takeaway:
Don’t frame CM vs PdM as “either/or.” Instead, think “portfolio strategy”:
- Use CM for broad coverage.
- Apply PdM to critical few assets where downtime costs are catastrophic.
Implementation Roadmap (Step-by-Step)
Jumping into Condition Monitoring (CM) or Predictive Maintenance (PdM) without a roadmap is a recipe for wasted budgets. The secret? Think in phases. Start small, prove value, scale smart.
Step 1 – Define Objectives & Asset Scope
- Identify critical assets (compressors, turbines, pumps).
- Set KPIs: downtime reduction, MTBF increase, maintenance cost savings.
- Prioritize based on criticality matrix (safety, production, cost).
Pro tip: Start with 5–10 pilot assets.
Step 2 – Data Readiness Assessment
- Review available sensors and data sources (vibration logs, SCADA, DCS, historian).
- Check data quality, frequency, and accessibility.
- Gap analysis: what sensors, gateways, or protocols are missing?
Step 3 – Select Monitoring Strategy
- CM → apply to mid-critical assets (fans, pumps, motors).
- PdM → apply to high-value equipment (turbines, compressors).
- Ensure strategy fits budget + maturity level.
Step 4 – Infrastructure & Integration
- Install/upgrade sensors (vibration, thermal, oil analysis).
- Set up communication (Modbus, OPC UA, MQTT).
- Integrate with CMMS/ERP for work order automation.
Key here: Keep architecture scalable & vendor-neutral.
Step 5 – Analytics & Visualization
- For CM → set thresholds & trending dashboards.
- For PdM → deploy advanced analytics (ML models, anomaly detection).
- Ensure human-friendly dashboards for reliability engineers.
Step 6 – Pilot & Validation
- Run 3–6 month pilot on selected assets.
- Track KPIs: unplanned downtime, false alarms, saved maintenance hours.
- Refine models, thresholds, or workflows.
Step 7 – Scale & Institutionalize
- Expand coverage to additional assets.
- Train teams in reliability engineering + data literacy.
- Establish governance: who owns data, models, and decision-making?
Step 8 – Continuous Improvement
- Review system performance annually.
- Update models with new failure data.
- Benchmark against industry best practices (ISO 13374, ISO 17359).
Evergreen Roadmap Summary Table
| Phase | Focus | Output |
|---|---|---|
| Step 1 | Asset scope & KPIs | Criticality ranking, pilot assets |
| Step 2 | Data readiness | Gap analysis, sensor map |
| Step 3 | Strategy selection | CM vs PdM plan |
| Step 4 | Infra & integration | Sensors, gateways, CMMS link |
| Step 5 | Analytics | Dashboards, alerts, ML models |
| Step 6 | Pilot | Validated results, ROI evidence |
| Step 7 | Scale | Wider rollout, training |
| Step 8 | Continuous improvement | Long-term optimization |
Key takeaway:
CM and PdM are not “install-and-forget.” They’re journeys. The roadmap ensures you move from pilot → ROI → scale, while staying evergreen and adaptable to future tech shifts.
Technology Enablers (Neutral)
Condition Monitoring (CM) and Predictive Maintenance (PdM) may sound futuristic, but at their core they rely on a set of evergreen technology enablers. These technologies don’t change every year, because they’re built on international standards and engineering fundamentals.
Here’s the breakdown.
Sensors: The Frontline of Data Capture
Without sensors, there is no CM or PdM. The choice of sensor depends on asset type and failure mode.
- Vibration sensors → ideal for rotating equipment (compressors, pumps, turbines).
- Thermal / infrared sensors → detect abnormal heat in motors, bearings, electrical panels.
- Acoustic / ultrasonic sensors → pinpoint leaks, partial discharge, cavitation.
- Oil debris & lubricant analysis sensors → reveal early signs of wear and contamination.
Key principle: Start with failure modes → choose sensor type → ensure proper placement & calibration.
Gateways & Protocols: Speaking a Common Language
Even the best sensors are useless if they can’t “talk” to control systems. That’s where gateways and protocols come in.
- Modbus (RTU/TCP) → legacy-friendly, still dominant in oil & gas.
- OPC UA → the modern standard for interoperability, widely supported in power & manufacturing.
- MQTT → lightweight, scalable protocol for cloud integration and IoT applications.
| Protocol | Strengths | Best Use Case |
|---|---|---|
| Modbus | Simple, robust, legacy-compatible | Brownfield upgrades in oil & gas |
| OPC UA | Interoperable, secure, structured data | Power plants, cross-vendor integration |
| MQTT | Lightweight, cloud-ready, low bandwidth | Remote assets, IoT PdM platforms |
Pro tip: Always design for future scalability. Use gateways that can handle multiple protocols, so you don’t get locked into one ecosystem.
CMMS/ERP Integration: Turning Data into Action
Collecting data is only half the job. The real value comes when insights trigger work orders and align with business processes.
- CMMS (Computerized Maintenance Management System) → schedules, tracks, and records maintenance.
- ERP (Enterprise Resource Planning) → integrates maintenance costs, spare parts, and procurement with finance and operations.
Evergreen framework for integration:
- Event trigger (sensor anomaly → CM alert).
- Work order creation in CMMS.
- Cost allocation and spare part check in ERP.
- Feedback loop: completed work order → back to PdM model for learning.
Best practice: Keep the workflow automated but supervised. Reliability engineers should validate high-impact alerts before they trigger costly shutdowns.
Why These Enablers Are Evergreen
- Sensors evolve, but vibration, thermal, acoustic, oil analysis will always be needed.
- Protocols (Modbus, OPC UA, MQTT) are standardized and remain industry anchors.
- CMMS/ERP is fundamental to maintenance and business alignment.
This makes the framework timeless – whether you’re running a refinery in 2025 or a power plant in 2035.
Key takeaway:
Technology enablers should be chosen with scalability, interoperability, and neutrality in mind. Don’t chase every shiny new sensor or IoT platform; focus on evergreen foundations that ensure your CM/PdM strategy is future-proof.
Buyer’s Guide (Long-Term Evergreen)
Choosing the right Condition Monitoring (CM) or Predictive Maintenance (PdM) solution is not just about comparing vendors – it’s about aligning technology with your long-term maintenance strategy. A structured buyer’s guide ensures you don’t get locked into short-lived trends, but instead invest in scalable, standards-driven solutions.
Core Features That Must Be Non-Negotiable
When evaluating CM/PdM platforms or sensors, look for these essential capabilities:
- Standards compliance → Supports ISO 13374 (CM data processing) and ISO 17359 (CM guidelines).
- Multi-sensor support → Vibration, thermal, acoustic, and oil debris should all be integrable.
- Open protocol compatibility → Must support Modbus, OPC UA, MQTT (future-proof).
- Automated alerts & reporting → Configurable thresholds, escalation logic.
- Data storage & accessibility → Historian capability with export to common formats (CSV, OPC UA, API).
Scalability & Flexibility
CM and PdM should evolve with your plant.
| Aspect | Evergreen Criteria |
|---|---|
| Sensor Expansion | Add new assets without replacing infrastructure |
| Cloud vs On-Prem | Hybrid options, so you’re not locked in |
| Analytics Growth | Ability to move from rule-based CM → ML-based PdM |
| Multi-site Support | Standardized templates for global rollouts |
Tip: Avoid systems that require custom-only development. Evergreen = modular + scalable.
Cybersecurity & Compliance
With IT/OT convergence, security is no longer optional. Evergreen buyer criteria include:
- Encryption → TLS/SSL for all data in transit.
- User access control → Role-based permissions, audit trail.
- Compliance → Must align with IEC 62443 (industrial cybersecurity).
- Patchability → Vendor provides regular updates without breaking compatibility.
Total Cost of Ownership (TCO)
Don’t just look at the upfront cost. Consider:
- Hardware lifecycle → Sensor calibration & replacement frequency.
- Software licensing → Avoid solutions tied to rigid per-asset licensing.
- Integration effort → Evaluate API availability vs costly custom integration.
- Training & support → Evergreen vendors provide documentation + user training, not just sales demos.
Buyer’s Checklist
Here’s a timeless checklist you can reuse in 2025, 2030, or beyond:
✅ Supports ISO & industry standards
✅ Multi-sensor, multi-protocol compatible
✅ Scalable architecture (edge + cloud + hybrid)
✅ CMMS/ERP integration ready
✅ Role-based access & cybersecurity compliance
✅ Transparent pricing & flexible licensing
✅ Clear ROI demonstration (downtime avoided vs cost)
✅ Vendor roadmap aligned with open standards, not lock-in
Vendor Mention (But Neutral)
While specific names will change over time, evergreen advice is:
- Shortlist 3-5 vendors.
- Score them against the checklist above (not just marketing claims).
- Pilot in a limited asset scope before scaling across the plant.
Key takeaway:
Don’t buy CM/PdM tools for what they promise today. Buy them for how they’ll still deliver value 10 years from now, in alignment with ISO standards, cybersecurity, and your plant’s growth roadmap.
Case Studies Across Industries (Timeless Lessons)
Real-world case studies are one of the best ways to bridge theory and practice. While specific technologies and vendors may evolve, the underlying lessons from different industries remain timeless.
Oil & Gas: Offshore Platform Reliability
- Context: Offshore platforms operate in extreme environments where downtime is measured in millions of dollars per day.
- Challenge: Mechanical failures in rotating equipment (compressors, pumps) often led to unplanned shutdowns.
- Approach: Operators deployed Condition Monitoring (vibration + oil debris analysis) as a first step, then gradually introduced PdM with AI anomaly detection.
- Lesson Learned:
- CM is a necessary foundation – without good baseline data, PdM models fail.
- Even with AI, human validation remains critical before making costly shutdown decisions.
- ROI was clear: a single avoided compressor failure covered the system investment many times over.
Power Plants: Turbine Performance Optimization
- Context: Gas and steam turbines are critical assets in both base-load and peaker plants. A single forced outage can destabilize the grid.
- Challenge: Traditional time-based maintenance led to unnecessary overhauls, while hidden faults escaped detection.
- Approach:
- Predictive Maintenance models using vibration and thermal data helped predict bearing degradation weeks in advance.
- Operators integrated PdM outputs into their Control System Architecture and CMMS for planned outages.
- Lesson Learned:
- PdM enables optimized outage scheduling, reducing lost generation revenue.
- Criticality assessment is essential: focus PdM on high-impact assets, use CM for balance-of-plant equipment.
- Hybrid approach (CM + PdM) outperforms one-size-fits-all.
Manufacturing: Production Line Efficiency
- Context: Automotive and FMCG factories rely on high-speed production lines with minimal tolerance for bottlenecks.
- Challenge: Frequent minor stoppages (bearing wear, misalignment) caused cumulative downtime.
- Approach:
- Condition Monitoring sensors on motors, gearboxes, and conveyors.
- Predictive algorithms flagged trends before bottlenecks became stoppages.
- Lesson Learned:
- In high-volume manufacturing, small savings compound into massive ROI.
- PdM isn’t just about avoiding catastrophic failures, but also about improving throughput consistency.
- Cross-training operators to interpret CM data created cultural adoption, not just technical success.
Cross-Industry Takeaways (Evergreen)
| Industry | Key Asset | Evergreen Lesson |
|---|---|---|
| Oil & Gas | Compressors, pumps | Start with CM → build PdM; ROI from avoided failures |
| Power | Gas/steam turbines | PdM enables outage optimization; focus on critical assets |
| Manufacturing | Motors, conveyors | Small downtime reductions = massive ROI; operator buy-in is key |
Timeless Insight:
Across industries, the winning formula is consistent:
- Build a strong CM foundation.
- Scale PdM where criticality and ROI justify it.
- Combine technology with human expertise and cultural adoption.
FAQ + Conclusion
Frequently Asked Questions (FAQ)
Q1. Do I always need Predictive Maintenance, or is Condition Monitoring enough?
- Not always. For low- to medium-critical assets, CM often delivers 80% of the value at 20% of the cost. PdM should be reserved for high-criticality assets where downtime has significant business or safety impact.
Q2. How do I calculate ROI for CM or PdM?
- Compare implementation cost (sensors, gateways, integration, training) with avoided downtime cost.
- A simple model:
| Metric | Example Value | Business Impact |
|---|---|---|
| Downtime cost per hour | $250,000 (offshore compressor) | Defines ROI potential |
| PdM system investment | $500,000 | One avoided failure justifies cost |
| Avoided downtime | 24 hours saved | $6M in savings |
Q3. Which standards should I follow?
- Condition Monitoring: ISO 13374, ISO 17359
- Predictive Maintenance: ISO 13381, IEC 61511 (for process safety context)
- These standards rarely change, making them evergreen references.
Q4. What’s the first step if my plant has no digital infrastructure yet?
- Start small:
- Instrument critical assets with basic CM sensors.
- Use simple dashboards before investing in AI-driven PdM.
- Build a data history first—without it, predictive models can’t work.
Q5. How often should I revisit my CM vs PdM strategy?
- At least every 2–3 years, or when:
- Asset mix changes (new turbines, compressors).
- Production goals shift (higher uptime requirements).
- Technology costs drop significantly.
Conclusion: Future-Proofing Asset Strategies
Condition Monitoring (CM) and Predictive Maintenance (PdM) are not competing strategies-they are complementary tools in the reliability toolbox.
- CM provides the foundation: reliable data, simple alerts, operator confidence.
- PdM builds the future state: advanced analytics, outage optimization, and AI-driven insights.
- The smartest organizations adopt a hybrid approach, scaling investment according to asset criticality, data maturity, and business objectives.
As we move beyond 2025, the message is clear:
Companies that balance CM and PdM-while keeping standards, ROI frameworks, and cultural adoption in mind-will consistently outperform peers in uptime, safety, and profitability.
This isn’t just a technology race. It’s a strategic mindset that will stay relevant for decades.